Saturday, January 20, 2007

Major trends in Global Automobile Industry

1) Mini and compact Segment to drive growth: - The sales in global car market are slowing down as most of the countries have reached the saturation level. Demand in Asian market surging and the mini and compact segment will drive the growth of the market. In India government has abolished the special excise duty of 8 % on small cars will help the manufacturer to price their models lower, leading the growth in the segment. A large part of the demand for the mini segment will come from the two wheeler customer upgrading to passenger cars, mostly in the semi urban and rural areas which will lead the mini compact segment growth in futures. The compact segment is also expected to make a significant contribution to the growth of passenger sales over the next 5 years. This segment is driven by the new entrants and price cuts owing to intense competition.

2) Growth in UV segment to be led by passenger UV: - Overall UV segment will witness the moderate growth but the share of passenger UV will increase tremendously. Higher end sports utility vehicle (SUV’s) will boost the passenger UV growth, albeit on a low base (as compare to other segment), due to the launch of new models and the perceived higher status attached to owning SUVs. However the UV used for commercial purpose will grow only at moderate rate

3) Increased Player thrust to boost the Share of Diesel Car: - The proportion of diesel car in global sales has been increasing as a long term trend. The proportion of fuel used in cars depends upon four key factors. These factors are: -

• Player thrust and model supply.
• Relative availability and overall economics of using each fuel.
• Relative consumer preference
• Environmental regulation.

Diesel penetration in car industry is increasing due to: -

• Continuation of price differential between petrol and diesel
• Increasing proportion of diesel model launch
• Growth revival in entry level car which will be predominantly based on petrol.

Players are also participating in the market dynamics and catering the demand of diesel cars. Europe has witnessed the increase in the proportion of diesel sales in the total car sales, Japanese player have been successful in creating a niche for hybrid cars. On the other hand American players like General Motors are developing fuel cell technology to increase the fuel efficiency of their products.

4) Opportunity for players in Low Cost Country to acquire Overseas Unit: - Low or stagnant automobile production growth in the USA, Western Europe, and Japan has forced the players to look at countries with better growth potential. Manufacturing units in America and Europe have huge capacities in line with their vast domestic automobile output. While this offered them the benefits of scale, the continuous sluggish growth in their local market and their inflationary increase in production cost, especially wage cost. Adoption of cost reduction measure became imperative for players to survive. China, India and Thailand have been regarded as the Low Cost Production bases with their unique offering to the outsourcers. Low cost country will provide them the global clientele and technology and also have synergetic operation. Area of opportunity for India lies in the products which have high level of design and engineering requirements, low level of automation and significant assembly requirement.

5) BRIC countries will be the potential destination for global players: - BRIC countries will be the potential destinations for global players. BRIC countries are expected to account for 47% of passenger car sales during years 2000-2010. (RNCOS’ report, “Passenger Car Market: A Global Review 2006")

6) The other factor determining the course of the auto industry is technology: -Historically the major driving forces behind technological implementation in the auto industry have been based on consumer demands for better vehicle performance and reliability. In recent years, technological improvements have also been aimed at areas such as safety, reduced environmental impact, and additional consumer features unrelated to the operation of the vehicle, such as stereo systems and navigational aides. New technologies are also determining the way the auto industry does business. In 1999, despite the fact that only 5 percent of the car sales were done through the Internet, as much as 40 percent of the buyers of a new vehicle in the US used it at least once to obtain information about the car they are buying (J.D. Power and Associates 2000). Sales through the web are expected have an explosive growth in the years to come. Changes are also happening at the level of the supply chain. With the recent announcement of Ford, General Motors, Daimler Chrysler, Renault, and Nissan to join their e-commerce initiatives, the auto industry is entering a new era of supply chain management.

7) Rising competition will offset scale and productivity benefits: - As globalization is the key trend in Industry, Competition is expected to intensify up by 2009-10 as more players enter the mainstream car segment (Compact or midsize) the outlook on profitability of the industry will change drastically. Process improvements and rising scale of operations have boosted the industry operating margin during the past 5 years significantly in the below mentioned areas; -

• Reduction in raw material cost due to measures like vendor rationalization and process improvement with the OEM and vendors.
• Reduction in labour cost
• Reduction in overhead

The industry capacity utilization growth rate will surge on the back of strong growth in volumes but these competition will negatively affect the margin in areas such as; -

• Fall in prices and hence in realization per car
• Increase in raw material cost, as some manufacturer will offer better preposition by providing more features at the same price.

8) Consolidation: - The global car industry will continue to consolidate over the next five years as manufacturers battle against the rise of Asian producers, overcapacity and the high cost of raw materials, automotive executives believe. The high number of Asian car bosses expecting further consolidation was driven partly by high expectations of consolidation in the Chinese industry. China has many relatively small car companies with only a few large firms, such as China Brilliance and Shanghai Automotive Industry Corporation. The bigger companies have generally expanded in partnership with Western companies, rather than on their own.

9) Environmentally Friendly Products: - As the auto industry faces recent slipping sales, clean energy vehicles are catching the attention of consumers looking for efficiency and environmentally friendly alternatives, giving manufacturers a new direction for growth. The momentum behind green cars is a reaction to a variety of factors such as fuel prices despite current declines, environmental issues such as greenhouse gas emissions and global national energy security concerns. While many companies pursue the plug-in hybrid models, full electric vehicles are rapidly grabbing industry attention. While there are very few publicly owned companies currently offering mass-produced electric cars? Nissan has plans for a 125-mile range all-electric car, but plans for production are targeted for 2010
Nissan SWOT Analysis

Nissan Motor Company Ltd (Nissan) is Japanese Company engaged in the automotive industry worldwide. The Company, including its associated brands, designs, produces and sells more than 3.7 million passenger cars and commercial vehicles in more than 190 countries. The Company is engaged in manufacture and sale of passenger automobiles, as well as the supply of automobile parts. Major overseas market for Nissan included Europe, North America, Africa, New Zealand and China.

The Company's major production sites are located in Japan, with additional facilities located in the United States, Mexico, the United Kingdom and Spain. In 1999, the Company established an alliance with Renault SA, a French automobile manufacturer. The alliance is designed to achieve profitable and balanced growth for the two partners through the creation of a bi-national group.

Nissan (Japan) is amongst the top three car manufacturers in Japan and the top five in the world. As well as its cars, pickups and sports utility vehicles, the company also has an interest in heavier vehicles and equipment such as vans, trucks, buses, components, aerospace, industrial machinery and marine equipment.

The SWOT Analysis of Nissan is as follows: -


Strength: -

1) Global Brand: - According to business Week Global Brand Scorecard Nissan is the fastest growing automotive brand. Nissan’s brand equity was valued at $3,108 million in 2006. Some of the company’s passenger car models include Maxima, Sentra, Altima, Versa, Z Roadstar and Z Coupe. Some of its truck models are Quest, Armada, Pathfinder, Murand and Xterra.

Brand strength provides competitive advantage that can offset the increasing competition. Over the last five years company has establish the global brand by focusing on the brand pyramid and dynamics that caters the silky design, the vibrant experience, the interplay between serenity and driving pleasure has reached a high level of alignment and consistency. That makes it easier to communicate about the brand and specific features of its model.

2) Global Financial position: - One of the Nissan key strength is its Global Financial Position. Five year financial highlights are shown below (figures are in USD Millions): -


Source: Nissan annual report 2005-06

From this table we are able to analyze Nissan’s financial position in 3 key areas – profitability, solvency and liquidity. Return on Assets (ROA) is a key indicator of profitability and thus, overall financial position and management. Since 2000, Nissan has a ROA of 5 % which is quite high for a company of such a large size. Furthermore, Nissan has had a Long Term/Assets Liabilities Ratio of between 0.19 and 0.22. This is an excellent figure and indicates that Nissan will be able to withstand tough economic conditions.

One final indicator of the strong financial position held by Nissan is its overall growth. From FY02 to FY06 inclusive, Nissan experienced an annual average of 13.8% revenue growth, 11.33% net income growth and 15.62% asset growth. These figures strongly support the argument that Nissan globally is in a strong financial position and will be able to provide Nissan Europe with backing to compete in the saturated European market.

3) Renault-Nissan Alliance: - The alliance has provided advantages to both companies. They can move into new markets faster and with lower costs because they don't have to build new plants. (Renault builds cars in Nissan's Mexico plants and Nissan uses Renault's Brazil plant and distribution networks) The companies are collaborating on building common platforms, components and engines, and each company leads engine design in their area of expertise--Renault in diesel and Nissan in gasoline. And they have increased purchasing power because they buy components for six million cars not three as will be in the case of Nissan alone. The alliance has so far boosted the profitability, market capitalization and sales in 192 countries for both partners. CEO and president of Renault to his titles in 2005, says he'll rely on the strengths of two distinct work forces: French innovation in concept stages and Japanese dedication to process in manufacturing.

Weakness: -

1) Dependence in overseas market: - Nissan produced a total of 3,378,000 units globally in FY2004. 1,482,000 million units of them were made at home and 1,896,000 units abroad. Nissan produces more vehicle abroad than at home. Increasingly dependent on overseas production indicating their pace of globalization. Nissan overseas dependency of operating income is over 50% which show they are in the fast lane of globalization.


The major risk of increasing dependency in other market is the risk associated with country in operation, financial transaction, and government policy. The figure below shows the declining share of total revenue at home and increasing share of overseas revenue. FY05-06 shows other foreign countries share as 10.6 against the 4.7 in FY03-04 which offset the revenue of Japan by 5%, while other proportion of total revenue remains the same.


2) Product Innovation time lag; - Nissan launched two new or redesigned vehicles, in comparison to 14 in the three previous years. Nissan has misjudged its model strategy in the United States over the past few years. Like the other Japanese automakers, the company was a relative late-comer to the country's high-profit margin and high-volume pick-up markets. Nissan's late entry meant that it has suffered from the decline in the sector as a result of rising fuel prices in the United States, While Toyota and Nissan have been well placed to benefit from a shift in emphasis in the U.S. market towards compact sales as a result of the Scion and Civic models respectively, Nissan at the moment has no competitive offering in this segment. However, there are a number of new models that should reinvigorate the company's fortunes in the United States, including the Sentra and Altima mid-size sedans, as well as its luxury-brand Infiniti G35 sedan. The company also desperately needs new offering in key segments in the European market. The Almera C-segment hatchback and Primera D-segment sedan are hopelessly outmoded and largely ignored by European buyers, although the new Note small multi-purpose vehicle (MPV) should provide Nissan with a sales success in Europe.

3) Lack of Diesel Technology: - In the Japanese market, diesel accounts for only 0.4% of vehicles sold (Rowley, 2006). In contrast, diesel is very popular and its share in overall sales has been increasing. In the year ending 1st January 2006 the number of diesel cars sold increased by 7.5%. Some analysts believe that the diesel market will account for more than 80% of total vehicle sales in Europe by the end of 2008. Diesel technology has been improving significantly over the past decade reducing emissions, fuel consumption and cost. As Nissan’s home country has a low demand for diesel engines, Nissan lacks the technology and experience to produce diesel engines of comparative quality.


Opportunity

1) Asia market: -Lower penetration coupled with strong rise in income levels, led to continuous jumps in car sales in markets like china and India. In fact china, followed by India is estimated to be major growth driver in the next decade. Hence it is necessary for global player to be present in these countries. Therefore all global players either have products for these markets or planning to develop products to enter into these markets. In India in year 2004-05 domestic sales of car and utility vehicles has crossed the 1 million mark.

2) Relocate its manufacturing unit to reduce cost: - The Japanese car maker has stepped up their policy of producing where demand exists. Car making is a industry situated at a forefront of globalization and major player is accelerating their cross border activities. Manufacturing units in America and Europe have huge capacities in line with their vast domestic automobile output. While this offered them the benefits of scale, the continuous sluggish growth in their local market and their inflationary increase in production cost, especially wage cost. Adoption of cost reduction measure became imperative for players to survive. China, India and Thailand have been regarded as the Low Cost Production bases with their unique offering to the outsourcers. Low cost country will provide them the global clientele and technology and also have synergetic operation. Area of opportunity for India lies in the products which have high level of design and engineering requirements, low level of automation and significant assembly requirement.

3) Renault-Nissan Purchasing Organization (RNPO): - The RNPO, which was established in 2001 in the early stages of the alliance, was one of the key ways in which Renault-Nissan would combine their resources to create a more efficient organization. Currently Nissan and Renault share 60% of the same part and raw material suppliers. This has led Nissan to achieve greater purchasing power and has served to reduce costs and reduce the bargaining power of suppliers. There still remains significant opportunity through the RNPO to decrease costs and provide increased competitive advantage.


Threats

1) Cross-Cultural Disharmony: - As Nissan and Renault become further integrated with one another, the risk of cross-cultural disharmony increases. If disharmony occurs then, as occurred at DaimlerChrysler, overall company performance may be reduced and the current strengths that the Alliance provides may become instabilities. Nissan is currently working to reduce the likelihood through its 'Business Way' program but corporate and national culture takes a long time to change.

2) Rising Commodity Prices: - Due to the economic expansion of China, changes in commodity prices could affect the costs incurred by Nissan. Over the past 12 months, the price of steel used in car production has risen by nearly 30% (London Metal Exchange, 2006). Nissan has taken steps to reduce the effect of rising steel prices; in 2000, Nissan began using hot dip zinc coated steel and converted to less expensive steel in 2002, which saved about $16 million per year (Nissan Motor Co., 2004). This however, has done little to reduce the upward pressure on vehicle costs and prices. As this increase in cost has been passed on to the consumer, demand for new vehicles has reduced. This threatens Nissan's viability in the region.

3) Market saturation: - With overall industry sales number stagnant, if not declining in key economies term, the overall automobile industry has been significantly impacted. Due to overall market saturation, the individual company new product development strategy towards market expansion is changing from iterative year on year model changes to drastic innovation. The emergence of SUV market few years back is an evidence of how product and market innovation has changed the very composition of US auto market.

Friday, November 24, 2006

Housing finance: Boom or bust?

The rapid growth of the mortgage industry in India in the recent years has raised concerns about its sustainability and implications on the country's financial and macroeconomic stability. The IMF, in its World Economic Outlook, 2003 indicated that output losses after real estate crashes in developed countries have, on an average, been twice as large as those after stock market crashes, usually resulting in lasting recessions. The fact that the surge in demand for mortgage credit has been trailed by an equally strong upturn in prices has led to apprehensions as to whether the boom is sustainable or is merely a financial bubble ready to burst. Further, the surge in housing prices globally has gone hand-in-hand with a much larger jump in household debt than in previous booms.

The magnitude of mortgage credit...

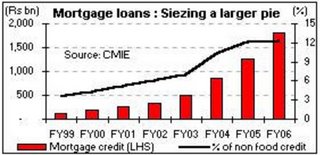
The pace of housing sector growth can be gauged from the fact that the total value of residential property in developed economies increased by an estimated US$ 20 trillion to over US$ 60 trillion in the last three years - which is higher than the increase in market capitalisation of global capital markets (Source: IMF). Housing market in India, as evidenced by the growth in bank exposures to the sector, took off mainly since FY01. Credit to the retail mortgage sector grew at a CAGR of 48% between FY01 to FY06 and comprised 12.3% of non-food credit against 3.5% in FY01. Also, as per the RBI's annual statement for FY07, the incremental growth in loans to commercial real estate and housing sectors clocked rates of 84% YoY and 29% YoY respectively in FY06.


Reasons for the surge...

The rapid growth in housing loan market has been jointly supported by the growth in middle class population, favourable demographic structure, relatively lower real estate prices, and more importantly, rise in disposable incomes. Furthermore, attractive fiscal incentives for housing loans make them ideal vehicles for tax planning for the salaried class. For banks and housing finance institutions, the regulatory framework facilitated the higher exposure by prescribing risk weights for housing loans and giving it the benefit of compliance with the targets mandated for priority sector lending. Besides, the loans were backed by the relative safety of such assets given the tangible nature of the primary security and the comfort obtained from the SARFAESI Act, 2002.

Versus the US...

In the United States, which is at present experiencing a strong cycle in the housing market, prices in certain regions have risen sharply if measured against the yardstick of affordability - calculated as the ratio of housing prices to annual income, reflecting a build up of the asset bubble. In fact, at present, the median price of new house in the US is more than 5 times the median household income.
Contrasting this, the scenario is India is still comfortable. At present, the median price of new house in India is 4 times the median household income as against 22 times in 1995. Also, thanks to fiscal incentives, the effective rate of home loan has come down to 4.5% in 2006 against 11.7% in 2000.

It's here to stay!

The mortgage to GDP ratio of 6% in India as against 54% in the US underscores the latent demand for the same. More so, with India being the second fastest growing economy in the world. Another interesting point to note is that while the home loan demand in the developed economies is largely for investment purposes (thus having a speculative component), 70% of the demand in India is for habitation purpose (thus making it less risky). Thus, the housing sector given its core importance in the developmental goals of the economy and in sustaining financial stability - is set to remain on the regulator's radar. However, investors need to judge their stance on the sector based on the fact that even if the current robust rate of growth may not be sustainable, the buoyancy in the sector may linger in the medium term.

Infrastructure Sector: Power, Engineering and Construction

Companies in sectors such as power, engineering & construction, capital goods and transportation were analysed on parameters like past growth record, growth prospects going forward, operating margins vis-à-vis other companies and ability to finance growth. So it is very difficult to analyse the industry first and than company, while here we have to adopt a different approach company with peer valuation.

Bhel

Bhel has grown at a rate of 25% CAGR in the past three years. Its order book has gone up from Rs 15,800 crore to Rs 37,500 crore during the same period, and is equal to nearly three years' FY06 sales. It is currently undergoing an expansion programme to increase capacity from 6,000 mw to 10,000 mw at an investment of Rs 1,200 crore, which is expected to be completed by the end of this fiscal.

Apart from topline strength, its operating and other margins are also better than its counterparts to a considerable extent. An important differentiator for Bhel is its low raw material/sales ratio at 45.6%, against the industry norm of 60-65%. As a result, its operating margin stands at 19.5%, against 12-14% for major competitors. But Bhel lags in working capital management, which leads to significant capital being blocked as working capital

The stock is trading at a price-earnings (P/E) multiple of about 33, which is less than that of other big players like Siemens and ABB. The company has cash reserves of more than Rs 4,000 crore, which is adequate for all its current needs. The company's growth rate should remain strong in the next few years.

Wednesday, November 08, 2006

India Automobile Industry

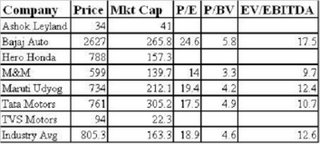
The Automobile Industry is witnessing an exciting growth of over 20% over past many years. This sector was a major cause of Sensex bull rally to take it to 13000. Today Indian automobile industry approximately has --- market capital with a strong presence of Tata Motors, Bajaj Auto and Maruti udyog globally.

Major threat for the industry is increase in interest rates and rising fuel price, but due to poor public transport and infrastructure the above two factor cannot able to cause any harm to industry yet. Major concern for automobile industry presently is the increasing cost of raw material which is pulling down its margin. Companies had to resort to increased discounting to tackle intensifying competition while simultaneously grappling with increasing prices of key raw materials such as steel and aluminum. Companies are now focusing on diversifying their raw material sourcing, rationalizing the vendor base for component sourcing, reducing wastage through value engineering and controlling development costs by using computer aided designing and testing techniques. Most of the companies are going for inorganic growth to have a good bargaining power with buyer and supplier, which will improve there margin pressure and increase there market share, for example Maruti Udyug is in talk with Nissan Suzuki agreement. Tata Motors is also coming with Joint venture with Marcopolo to increase its passenger transport system. M&M is also planning to launch passenger cars and HCV (Heavy commercial Vehicle) with Joint Ventures.

Monday, October 16, 2006

Comparison between India and China

The India and China comparison is the centre of attraction not only in the Asia but the whole world is watching. It’s mainly because of the 40% of world population resides in India and China and both economic has a great resembles. In 1991, India and China stood at the same level of economic development. Today China per capita is hitting US $ 1700 while India is lagging behind with US $ 700. The two nations has approached the development in very different way, India has chosen service based growth model where China has pursed a manufacturing base growth strategy. India share of service in GDP is increasing from 41% to 54% in 2005 while China manufacturing share in GDP has increased from 42% to 47% in 2005. In contrast India Industry growth is stagnant with 28% from years.

Macro Indicators

India

Area: sq. km.
Population (2006): 1,107 million
Annual population growth rate: 1.6%
Ethnic groups:
GDP: - US $ 0.83 trillion (2005)
GDP - per capita: US $ 700
Inflation rate – 4.5% (2006)/annum

Australia

Area: 7.7 million sq. km.
Population (2005): 20.2 million.
Annual population growth rate: 1.1%
Ethnic groups: European 92%, Asian 6%, Aboriginal 2%.
GDP: - US$631.3000 billion (2004)
GDP - real growth rate: 3.2% (2006)
GDP - per capita: US$ 34324.578
Inflation rate 2.7% (2006)/annum

China

Area:
Population: 1.3 billion.
Annual Population growth rate: 5.87%
GDP: US $ 2.23 trillion (2005)
GDP - per capita: US $ 1700