Friday, November 24, 2006

Housing finance: Boom or bust?

The rapid growth of the mortgage industry in India in the recent years has raised concerns about its sustainability and implications on the country's financial and macroeconomic stability. The IMF, in its World Economic Outlook, 2003 indicated that output losses after real estate crashes in developed countries have, on an average, been twice as large as those after stock market crashes, usually resulting in lasting recessions. The fact that the surge in demand for mortgage credit has been trailed by an equally strong upturn in prices has led to apprehensions as to whether the boom is sustainable or is merely a financial bubble ready to burst. Further, the surge in housing prices globally has gone hand-in-hand with a much larger jump in household debt than in previous booms.

The magnitude of mortgage credit...

The pace of housing sector growth can be gauged from the fact that the total value of residential property in developed economies increased by an estimated US$ 20 trillion to over US$ 60 trillion in the last three years - which is higher than the increase in market capitalisation of global capital markets (Source: IMF). Housing market in India, as evidenced by the growth in bank exposures to the sector, took off mainly since FY01. Credit to the retail mortgage sector grew at a CAGR of 48% between FY01 to FY06 and comprised 12.3% of non-food credit against 3.5% in FY01. Also, as per the RBI's annual statement for FY07, the incremental growth in loans to commercial real estate and housing sectors clocked rates of 84% YoY and 29% YoY respectively in FY06.


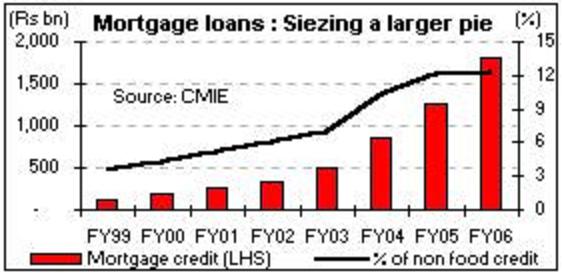
Reasons for the surge...

The rapid growth in housing loan market has been jointly supported by the growth in middle class population, favourable demographic structure, relatively lower real estate prices, and more importantly, rise in disposable incomes. Furthermore, attractive fiscal incentives for housing loans make them ideal vehicles for tax planning for the salaried class. For banks and housing finance institutions, the regulatory framework facilitated the higher exposure by prescribing risk weights for housing loans and giving it the benefit of compliance with the targets mandated for priority sector lending. Besides, the loans were backed by the relative safety of such assets given the tangible nature of the primary security and the comfort obtained from the SARFAESI Act, 2002.

Versus the US...

In the United States, which is at present experiencing a strong cycle in the housing market, prices in certain regions have risen sharply if measured against the yardstick of affordability - calculated as the ratio of housing prices to annual income, reflecting a build up of the asset bubble. In fact, at present, the median price of new house in the US is more than 5 times the median household income.
Contrasting this, the scenario is India is still comfortable. At present, the median price of new house in India is 4 times the median household income as against 22 times in 1995. Also, thanks to fiscal incentives, the effective rate of home loan has come down to 4.5% in 2006 against 11.7% in 2000.

It's here to stay!

The mortgage to GDP ratio of 6% in India as against 54% in the US underscores the latent demand for the same. More so, with India being the second fastest growing economy in the world. Another interesting point to note is that while the home loan demand in the developed economies is largely for investment purposes (thus having a speculative component), 70% of the demand in India is for habitation purpose (thus making it less risky). Thus, the housing sector given its core importance in the developmental goals of the economy and in sustaining financial stability - is set to remain on the regulator's radar. However, investors need to judge their stance on the sector based on the fact that even if the current robust rate of growth may not be sustainable, the buoyancy in the sector may linger in the medium term.

Infrastructure Sector: Power, Engineering and Construction

Companies in sectors such as power, engineering & construction, capital goods and transportation were analysed on parameters like past growth record, growth prospects going forward, operating margins vis-à-vis other companies and ability to finance growth. So it is very difficult to analyse the industry first and than company, while here we have to adopt a different approach company with peer valuation.

Bhel

Bhel has grown at a rate of 25% CAGR in the past three years. Its order book has gone up from Rs 15,800 crore to Rs 37,500 crore during the same period, and is equal to nearly three years' FY06 sales. It is currently undergoing an expansion programme to increase capacity from 6,000 mw to 10,000 mw at an investment of Rs 1,200 crore, which is expected to be completed by the end of this fiscal.

Apart from topline strength, its operating and other margins are also better than its counterparts to a considerable extent. An important differentiator for Bhel is its low raw material/sales ratio at 45.6%, against the industry norm of 60-65%. As a result, its operating margin stands at 19.5%, against 12-14% for major competitors. But Bhel lags in working capital management, which leads to significant capital being blocked as working capital

The stock is trading at a price-earnings (P/E) multiple of about 33, which is less than that of other big players like Siemens and ABB. The company has cash reserves of more than Rs 4,000 crore, which is adequate for all its current needs. The company's growth rate should remain strong in the next few years.

Wednesday, November 08, 2006

India Automobile Industry

The Automobile Industry is witnessing an exciting growth of over 20% over past many years. This sector was a major cause of Sensex bull rally to take it to 13000. Today Indian automobile industry approximately has --- market capital with a strong presence of Tata Motors, Bajaj Auto and Maruti udyog globally.

Major threat for the industry is increase in interest rates and rising fuel price, but due to poor public transport and infrastructure the above two factor cannot able to cause any harm to industry yet. Major concern for automobile industry presently is the increasing cost of raw material which is pulling down its margin. Companies had to resort to increased discounting to tackle intensifying competition while simultaneously grappling with increasing prices of key raw materials such as steel and aluminum. Companies are now focusing on diversifying their raw material sourcing, rationalizing the vendor base for component sourcing, reducing wastage through value engineering and controlling development costs by using computer aided designing and testing techniques. Most of the companies are going for inorganic growth to have a good bargaining power with buyer and supplier, which will improve there margin pressure and increase there market share, for example Maruti Udyug is in talk with Nissan Suzuki agreement. Tata Motors is also coming with Joint venture with Marcopolo to increase its passenger transport system. M&M is also planning to launch passenger cars and HCV (Heavy commercial Vehicle) with Joint Ventures.

Monday, October 16, 2006

Comparison between India and China

The India and China comparison is the centre of attraction not only in the Asia but the whole world is watching. It’s mainly because of the 40% of world population resides in India and China and both economic has a great resembles. In 1991, India and China stood at the same level of economic development. Today China per capita is hitting US $ 1700 while India is lagging behind with US $ 700. The two nations has approached the development in very different way, India has chosen service based growth model where China has pursed a manufacturing base growth strategy. India share of service in GDP is increasing from 41% to 54% in 2005 while China manufacturing share in GDP has increased from 42% to 47% in 2005. In contrast India Industry growth is stagnant with 28% from years.

Macro Indicators

India

Area: sq. km.
Population (2006): 1,107 million
Annual population growth rate: 1.6%
Ethnic groups:
GDP: - US $ 0.83 trillion (2005)
GDP - per capita: US $ 700
Inflation rate – 4.5% (2006)/annum

Australia

Area: 7.7 million sq. km.
Population (2005): 20.2 million.
Annual population growth rate: 1.1%
Ethnic groups: European 92%, Asian 6%, Aboriginal 2%.
GDP: - US$631.3000 billion (2004)
GDP - real growth rate: 3.2% (2006)
GDP - per capita: US$ 34324.578
Inflation rate 2.7% (2006)/annum

China

Area:
Population: 1.3 billion.
Annual Population growth rate: 5.87%
GDP: US $ 2.23 trillion (2005)
GDP - per capita: US $ 1700

Sunday, October 15, 2006

Trucking Sector

In this section we have tried to analyze the trucking industry in depth. Before we dive into the details, we thought it helpful to remind readers that trucking industry is the most fragmented industry since the organized player has less than 15% of the market share and no requirement for industry to report the industry capacity (as in the case of railway and airline industry). The traffic flow and cost data is not collected in a systematic and regular way. So, data available on industry capacity, population and scrap age is not authenticated data, but it in the same time it gives us the essence where the industry is heading in the presence of large number of small fleet owners, huge capacity and the competition given by rail.

Based on the study forecast demand model that is build upon industrial and agriculture composition that generate freight and replacement demand, we expect 10-12% of growth in CV goods segment over FY07 to FY09 as the freight will increase by 12-13% YoY and the replacement demand will be 37-38% of overall sales. The trucking industry is going through the consolidating period with better operating economics of new trucks (better fuel efficiency and load carrying capacity), construction of highways and overall buoyant economics (that industrial growth of 7% and agricultural growth of 3%) that all sustenance for better structure of industry which support the 10-12% growth in CV demand. In addition, a positive step taken by Supreme Court in banning the overloading for robust industry by giving verdicts that overloading cannot be legalized by the schemes like the issuance of golden passes, has caused freight rates to remain strong improving profitability of fleet operator despite high diesel prices and operating cost will drive the CV growth in future.

Commercial Vehicle goods Industry set to grow yet another year on year after five consecutive years of growth from FY02 to FY06. The CV sales had grown by 26% CAGR from FY02 – FY06 that was due to increase in 12% freight and strong average replacement demand of 55% on overall sales. Replacement as a percentage of 5-6years old vehicles has also surged due to weak sales of CV in FY98-01 from 26% to 48%. In moving forward study expect the industry to behave in the same with strong support from economic activities.FY 02-06 has seen near identical growth rates for M&HCVs and LCVs segment. In contrary there is shift within the segment like revolutionary launch of Tata’s Ace in LCV segment has reverse the demand of below 3.5 tonnes vehicle with 3.5 < 7.5 tonnes vehicle (i.e. in FY02 sales of 3.5<7.5 vehicle was 25% in overall sales which is now 13% and in case of below 3.5 tonnes it was 13% which rises to 27%) and able to catch the attention of transporter which take the goods to end user. Moreover looking forward in future some new models in LCV segment can change the dynamics of the segment with more interchange within the segment can happen. In M&HCV segment which has also outperformed with the increase in demand of 25 tonnes vehicle that offset the high price of fuel with better fuel efficiency and fast turnaround time has also changed the customer preference in this segment.